Analytics
Explain spending, reference savings, failed requests, and account changes.
Overview
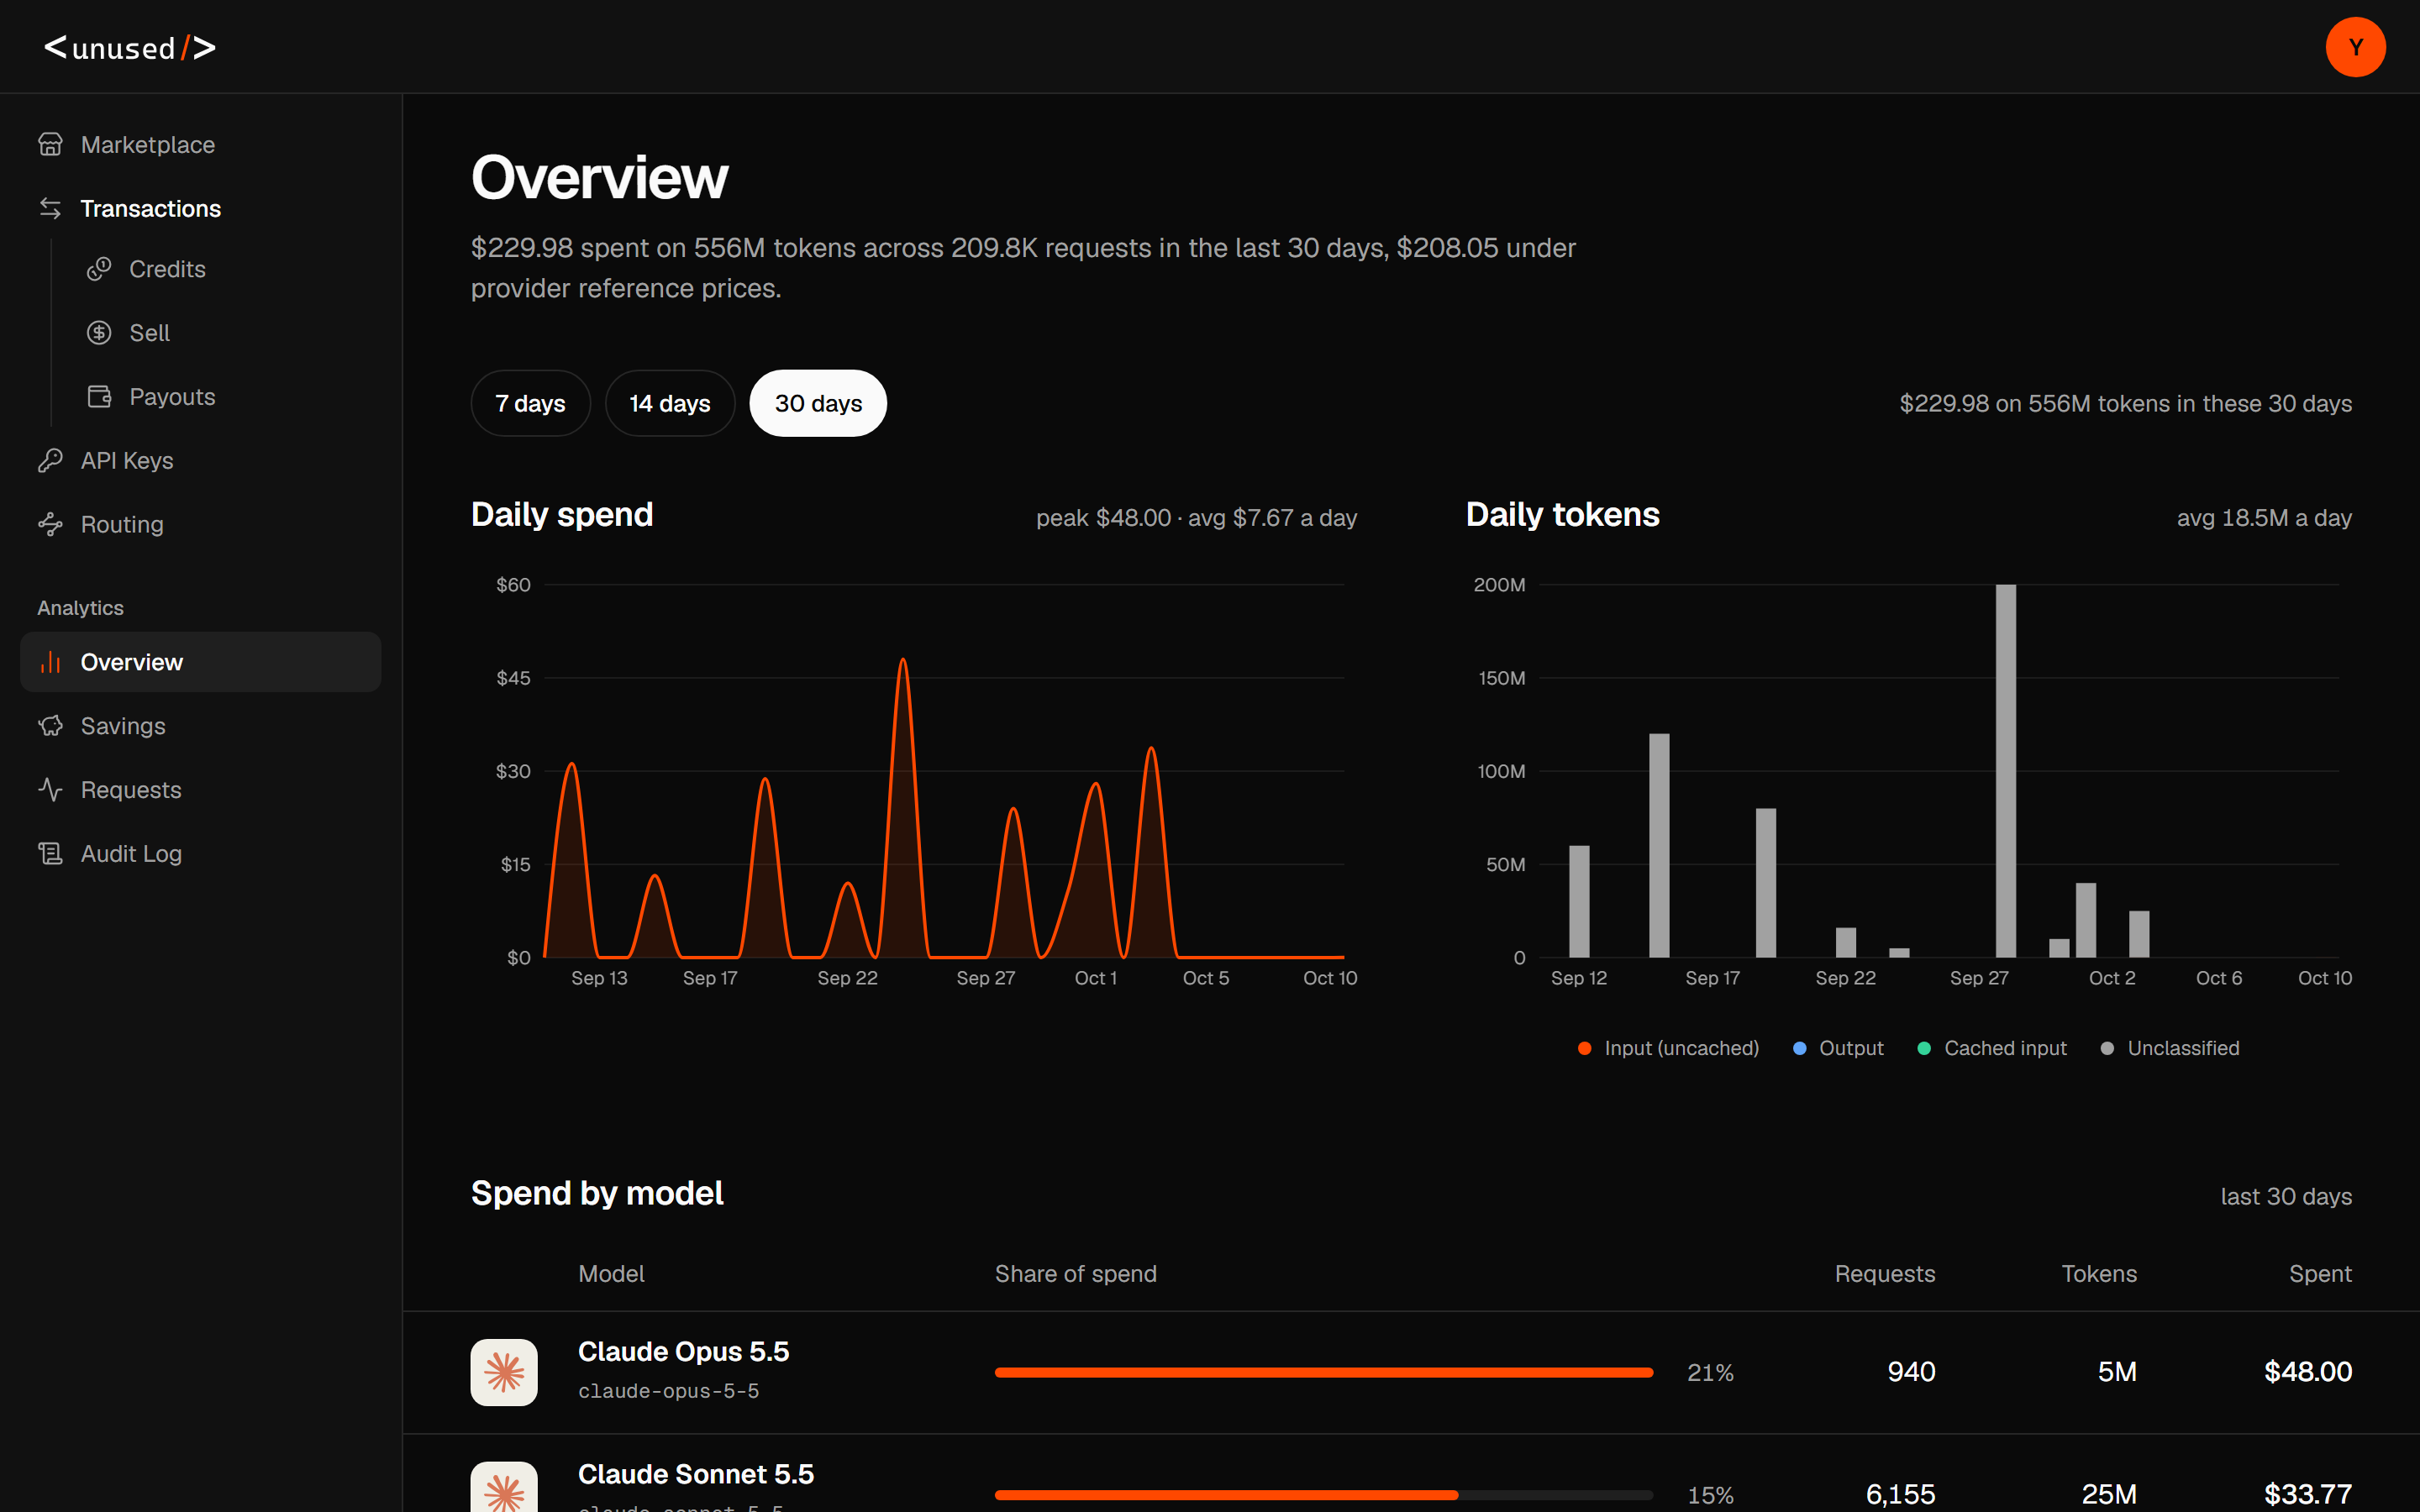
Open Analytics → Overview to find which models drive spending. The page summary and Spend by model cover the last 30 UTC dates, including today. 7 days, 14 days, and 30 days change the daily charts and the figures beside those charts; they do not change the 30-day page summary or model table.
| Metric or column | Meaning |
|---|---|
| Summary spend / Spent / Spend | Settled request cost in USD in the stated range. |
| Requests | Request count recorded in the daily usage aggregates. Use Requests history for individual failures and status counts. |
| Tokens / Total tokens | Input plus output tokens; cache reads are already included in input. |
| Amount under/above reference | Reference cost minus paid cost for usage with the required reference rates. |
| Model | Model name and its canonical request ID. |
| Share of spend | Model spend divided by total spend; the displayed percentage is rounded. |
| Daily spend average | Selected chart-range spend divided by the number of dates in that range. |
| Daily spend peak | Highest single-date spend in the selected chart range. |
| Daily token average | Selected chart-range tokens divided by the number of dates in that range. |
| Input (uncached) | Input tokens minus reported cache reads; this label can include cache writes. |
| Output | Generated output tokens. |
| Cached input | Provider-reported cache-read tokens. |
| Unclassified | Aggregate tokens without an available detailed input/output split. |
| Date | UTC date used to aggregate usage. |
Expand View daily figures as a table for exact daily counts. Unavailable means the detailed token breakdown cannot be reconstructed; it does not mean zero usage.
Use this page to locate a spending increase: compare daily spend and token volume, then inspect the highest-spend model. An increase in cost without the same increase in tokens can reflect a different model, input/output mix, cache usage, or offer rate; use request history to narrow it down.
Savings
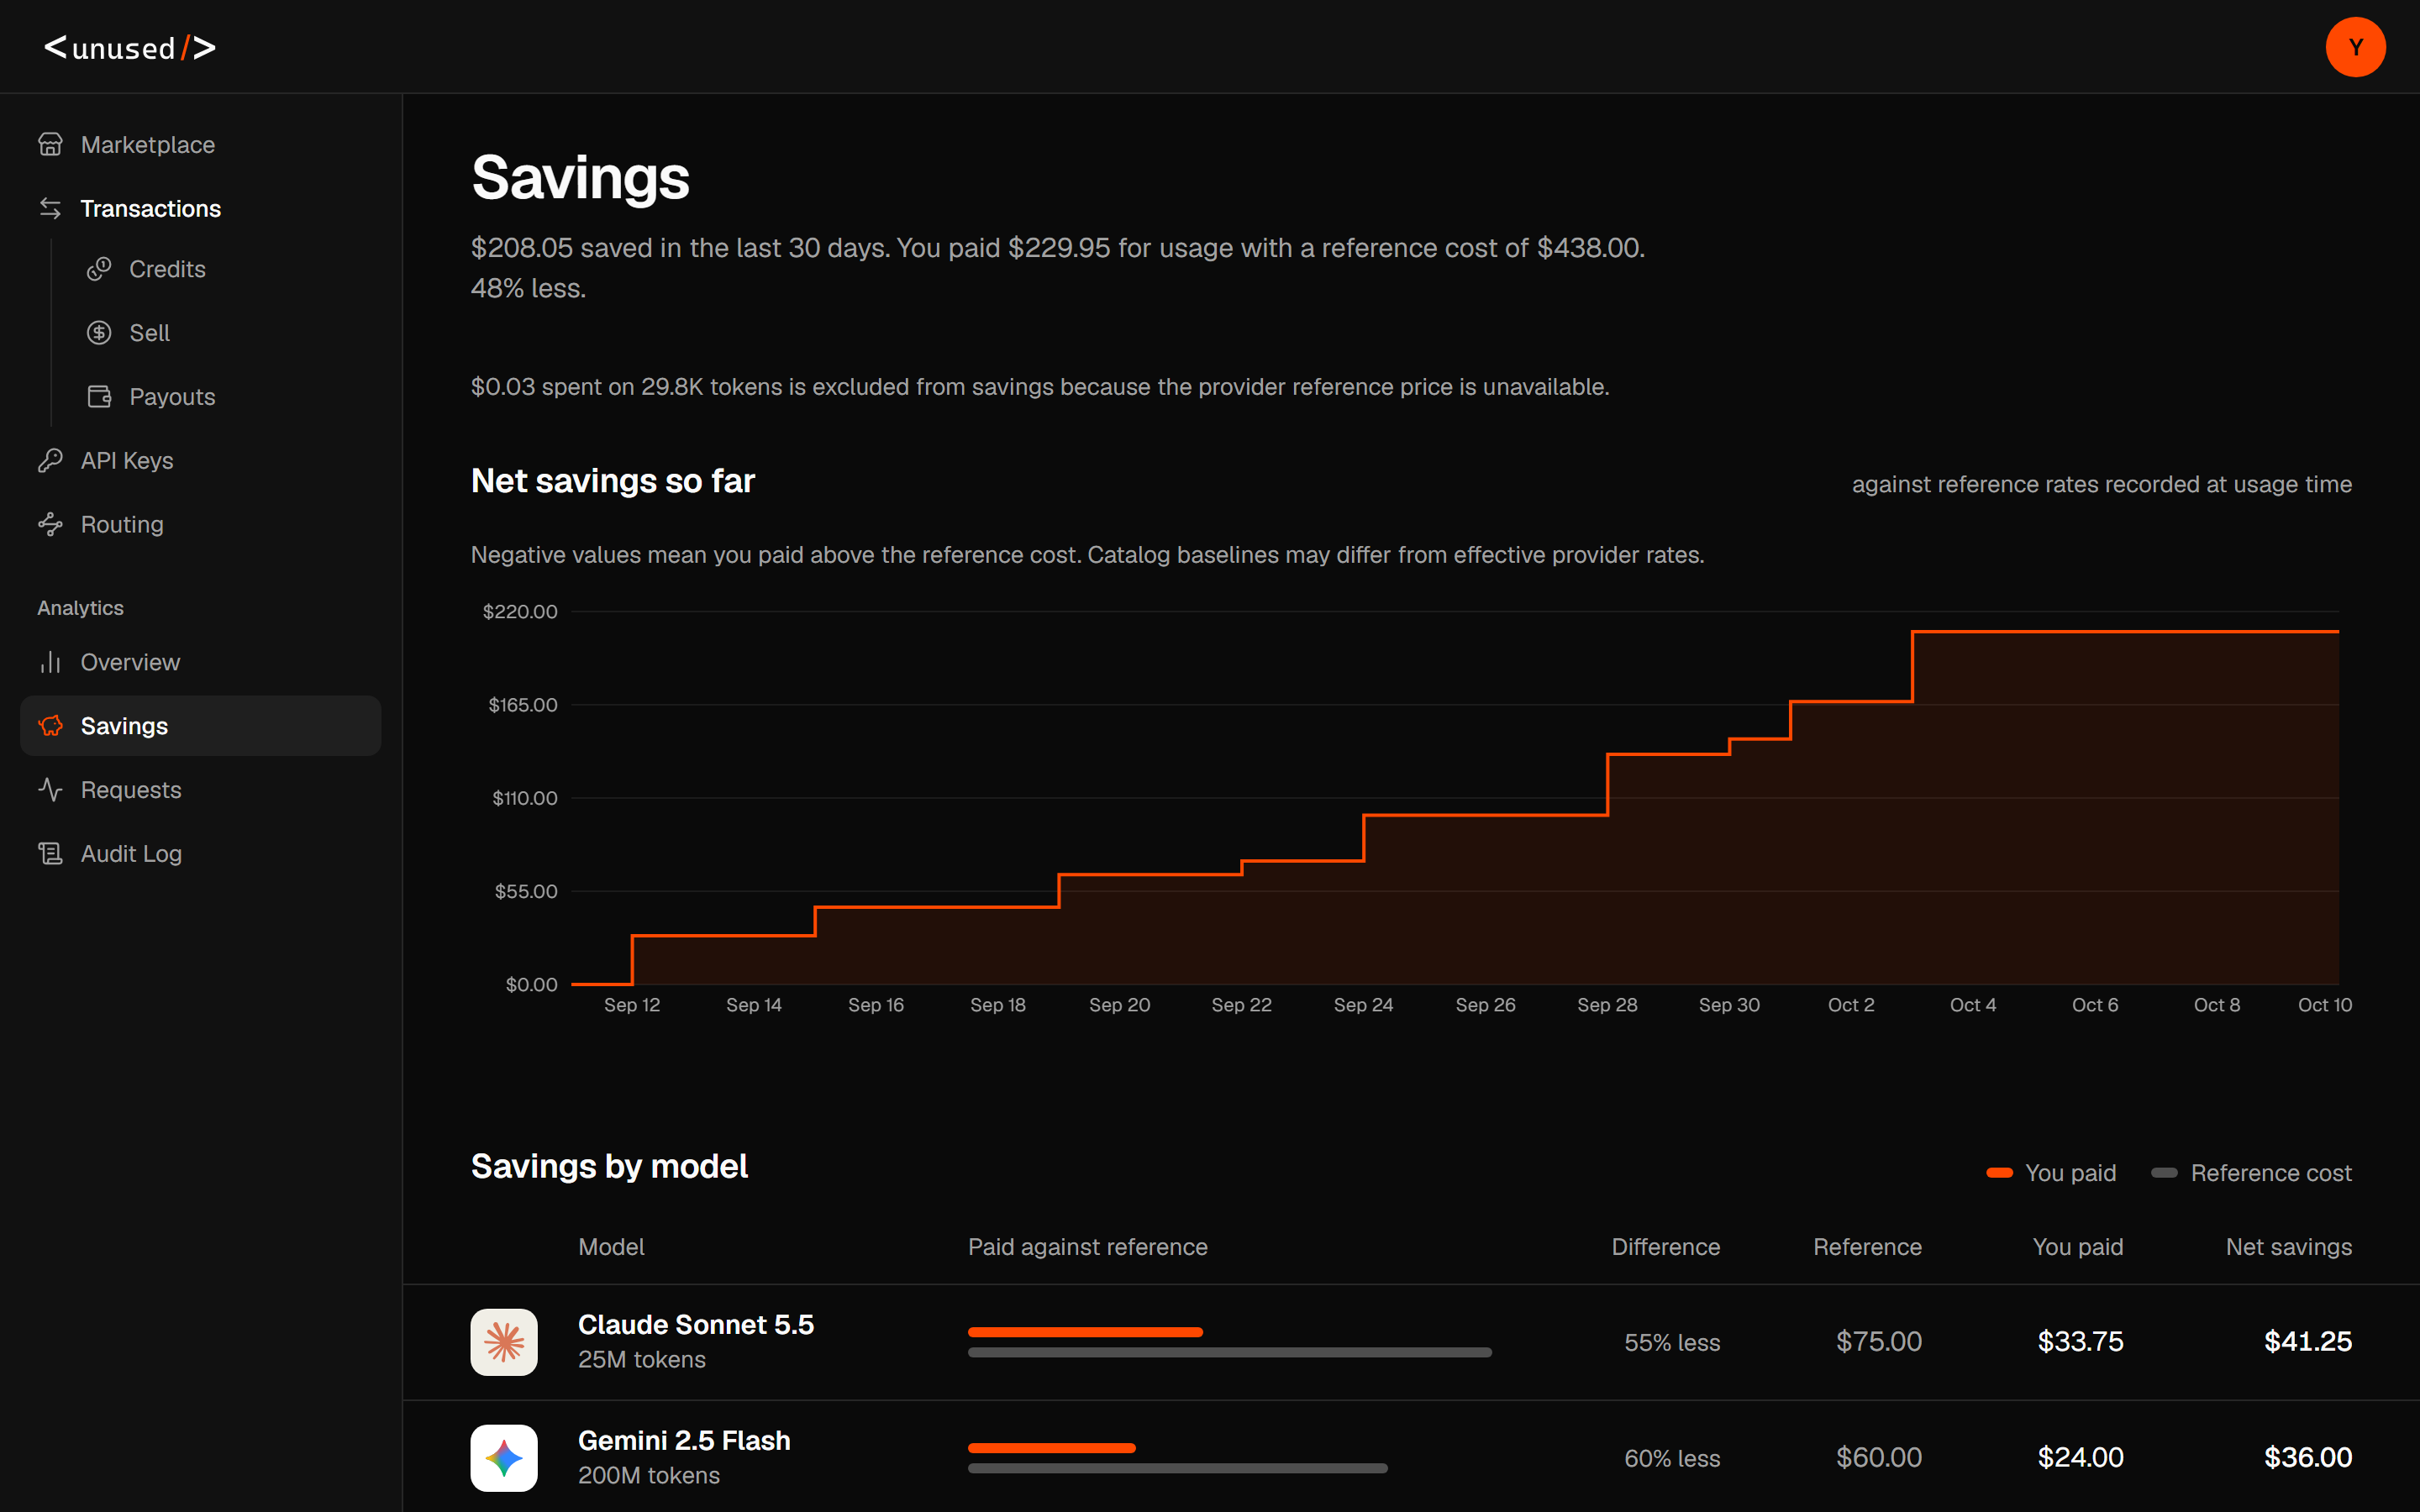
Open Analytics → Savings to compare the last 30 UTC dates with reference rates recorded at usage time.
| Metric or column | Meaning |
|---|---|
| You paid | Actual cost of the usage included in the reference comparison. |
| Reference / Reference cost | Cost of that usage at the captured reference rates. |
| Net savings | Reference cost minus paid cost. Negative values mean you paid above reference. |
| Difference | Percentage difference relative to reference cost: (reference − paid) / reference × 100. |
| Net savings so far | Cumulative net savings across the displayed date range. |
| Paid against reference | Two bars comparing paid and reference amounts on the same scale. |
| Tokens under a model | Tokens included in that model's priced comparison. |
| Excluded spend and tokens | Usage without the reference rates needed to calculate a fair comparison. The API names these unpricedPaid and unpricedTokens. |
Unpriced usage is excluded from both compared paid and reference totals. Do not treat it as free usage or zero savings. Reference catalogs can differ from your effective vendor invoice, so use the page for a consistent comparison, not invoice reconciliation against another account.
Use this page to identify expensive models relative to the reference. Check Marketplace and your routing strategy before changing models; the reference is a comparison baseline, not a price cap.
Requests
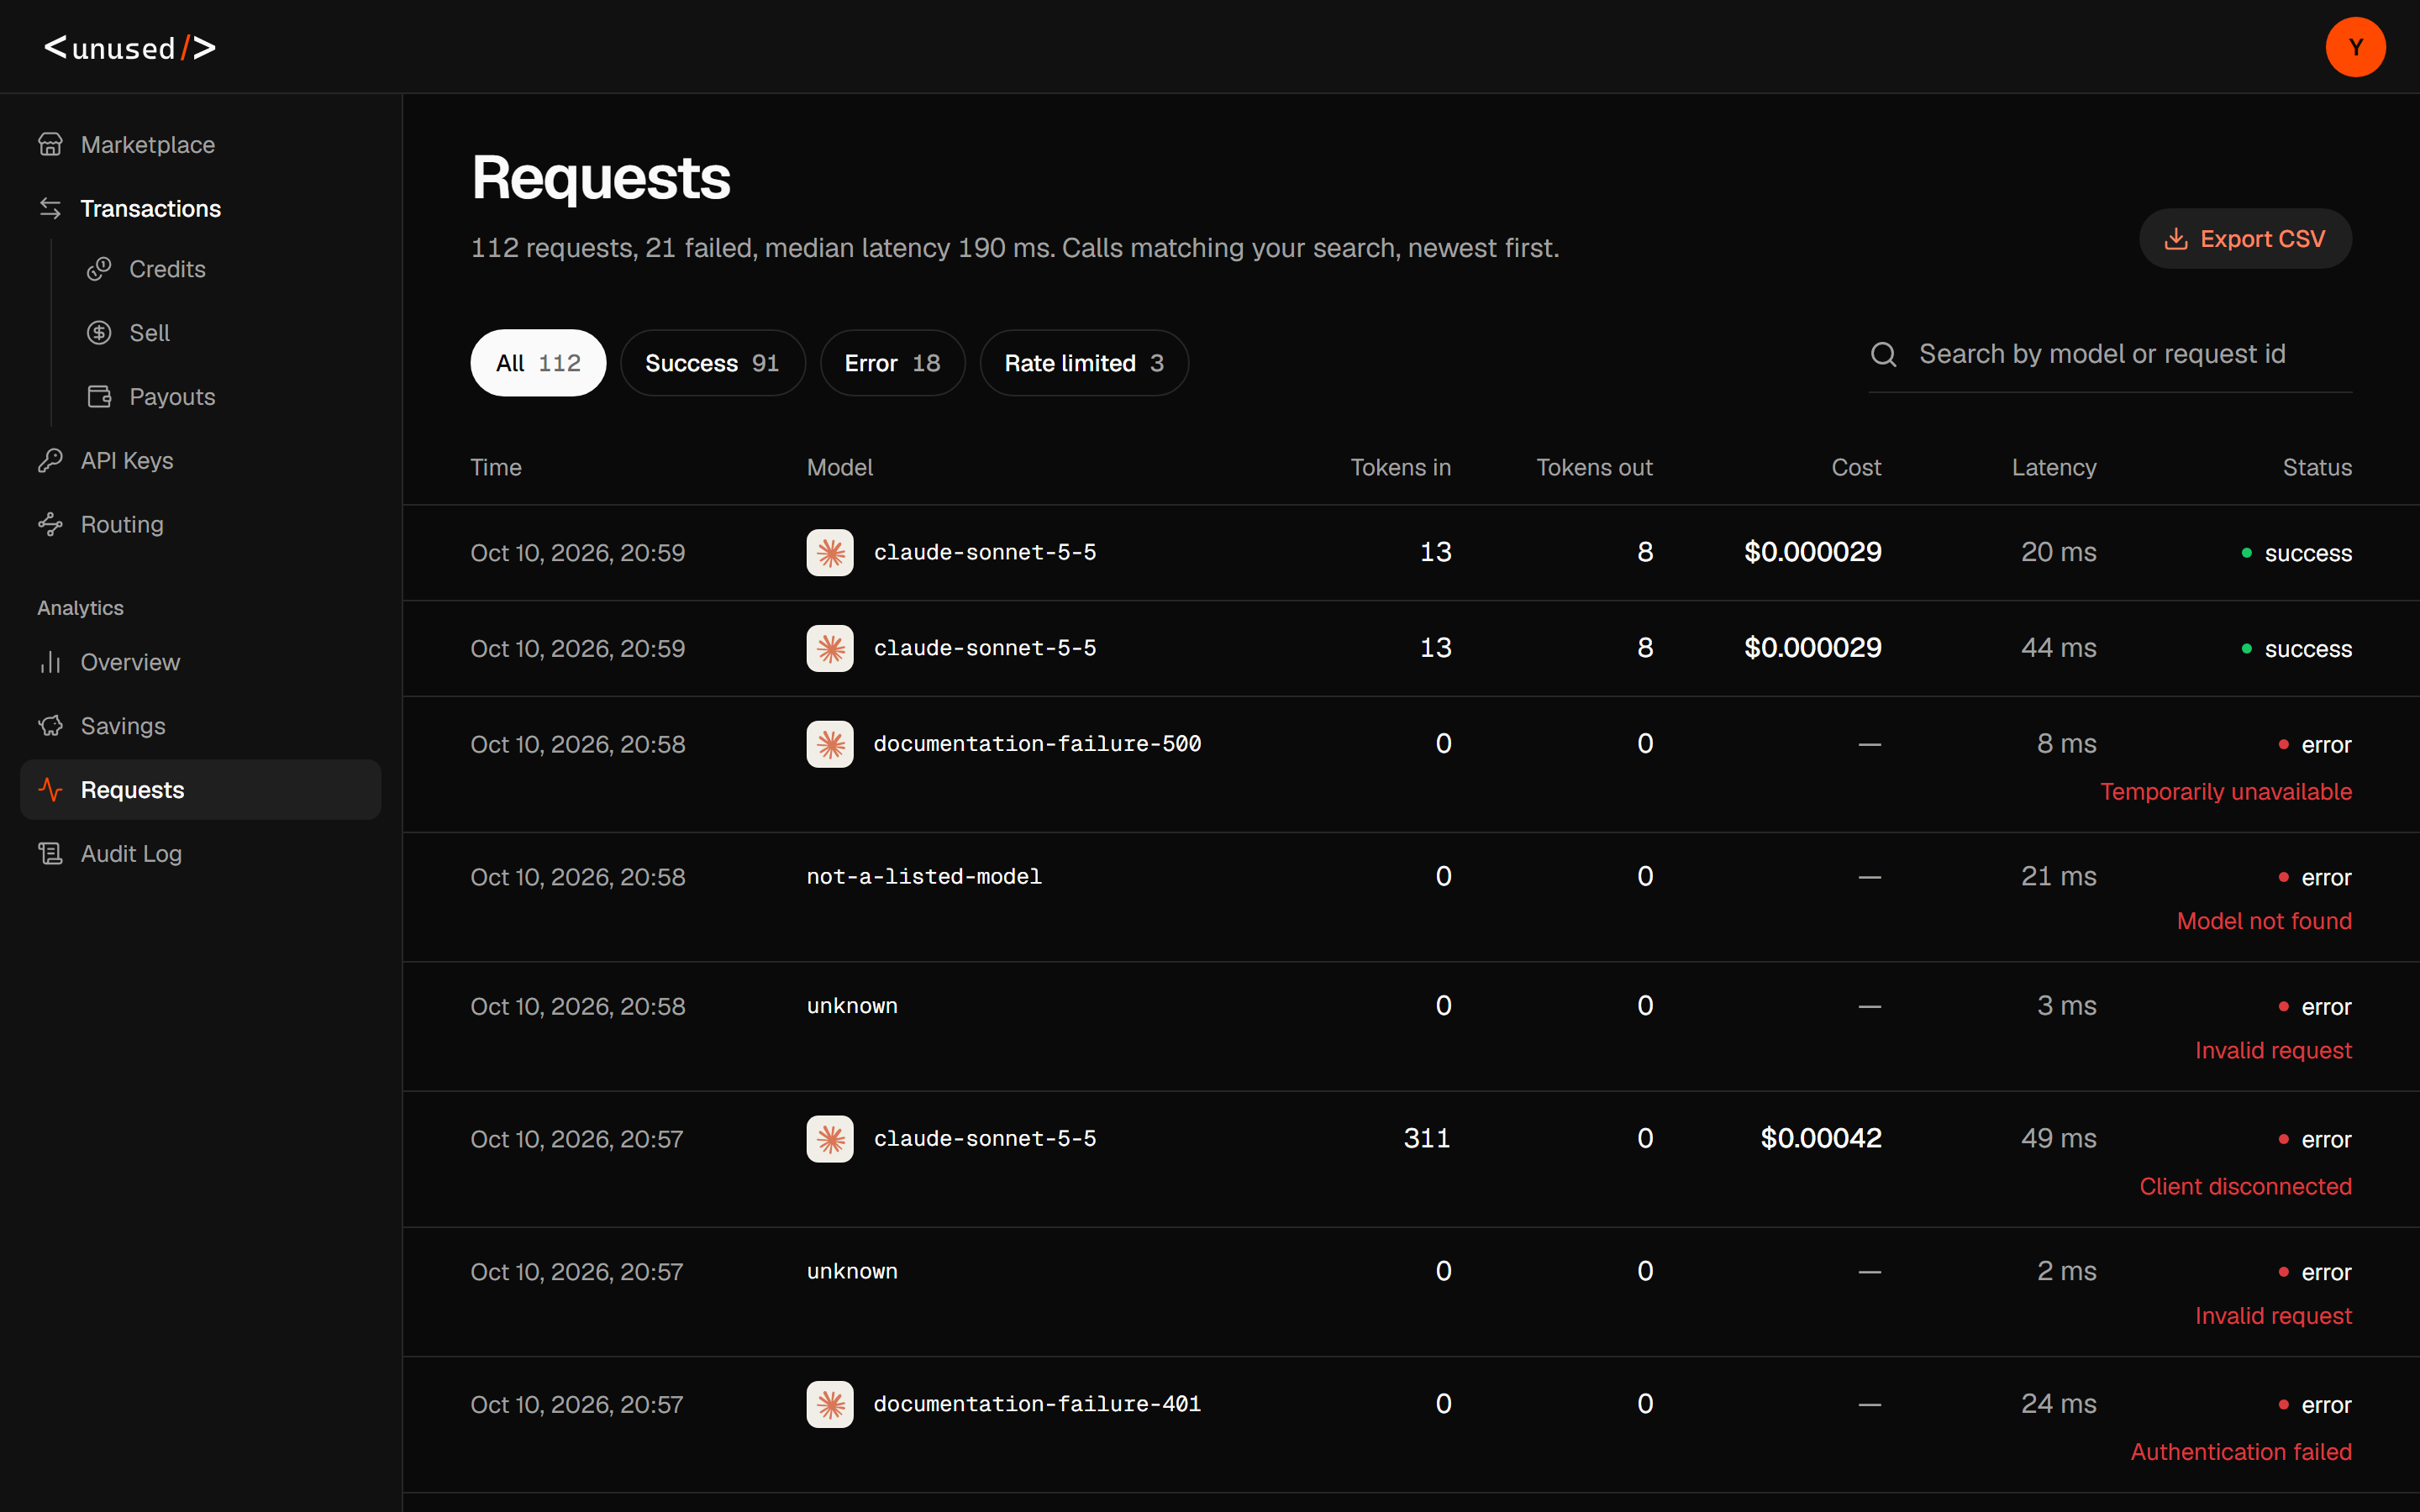
Open Analytics → Requests to investigate one call. Paste x-request-id into Search by model or request id, or search part of a model ID. Results are newest first. All, Success, Error, and Rate limited filter the rows.
| Metric or column | Meaning |
|---|---|
| Time | Recorded request timestamp. The request ID is searchable and appears in CSV, but is not displayed in the current table rows. |
| Model | Requested/resolved model ID; requests rejected before model resolution can show unknown. |
| Tokens in | All input tokens, with reported cached reads shown beneath when present. |
| Tokens out | Output tokens recorded for the request. |
| Cost | Settled request charge in USD; cache savings can appear below it. |
| Cache savings | Difference between charging the recorded input without cache discounts and the final charge. |
| Latency | Total recorded request duration in milliseconds, not time to first token. |
| Status | success, error, or rate limited, with a safe failure reason for unsuccessful calls. |
| Status counts | Counts matching your search across history, before the selected status filter or pagination. |
| Failed count | Error plus rate-limited requests matching the search. |
| Median latency | Median total latency over the same search-matching history, before status filtering. |
Select Export CSV to export the current search and status filter. The columns are id, time, model, tokens_in, tokens_out, cached_tokens_in, cache_savings_usd, cost_usd, latency_ms, status, and error_reason. CSV time is an ISO timestamp. Use full-precision CSV cost values when aggregating small requests for accounting.
For “why did this fail?”, search the ID and use the reason with the failure table. For “which offer is faster?”, compare TTFT on the model's Marketplace offers: Requests does not expose offer TTFT or a per-attempt routing trace.
Audit Log
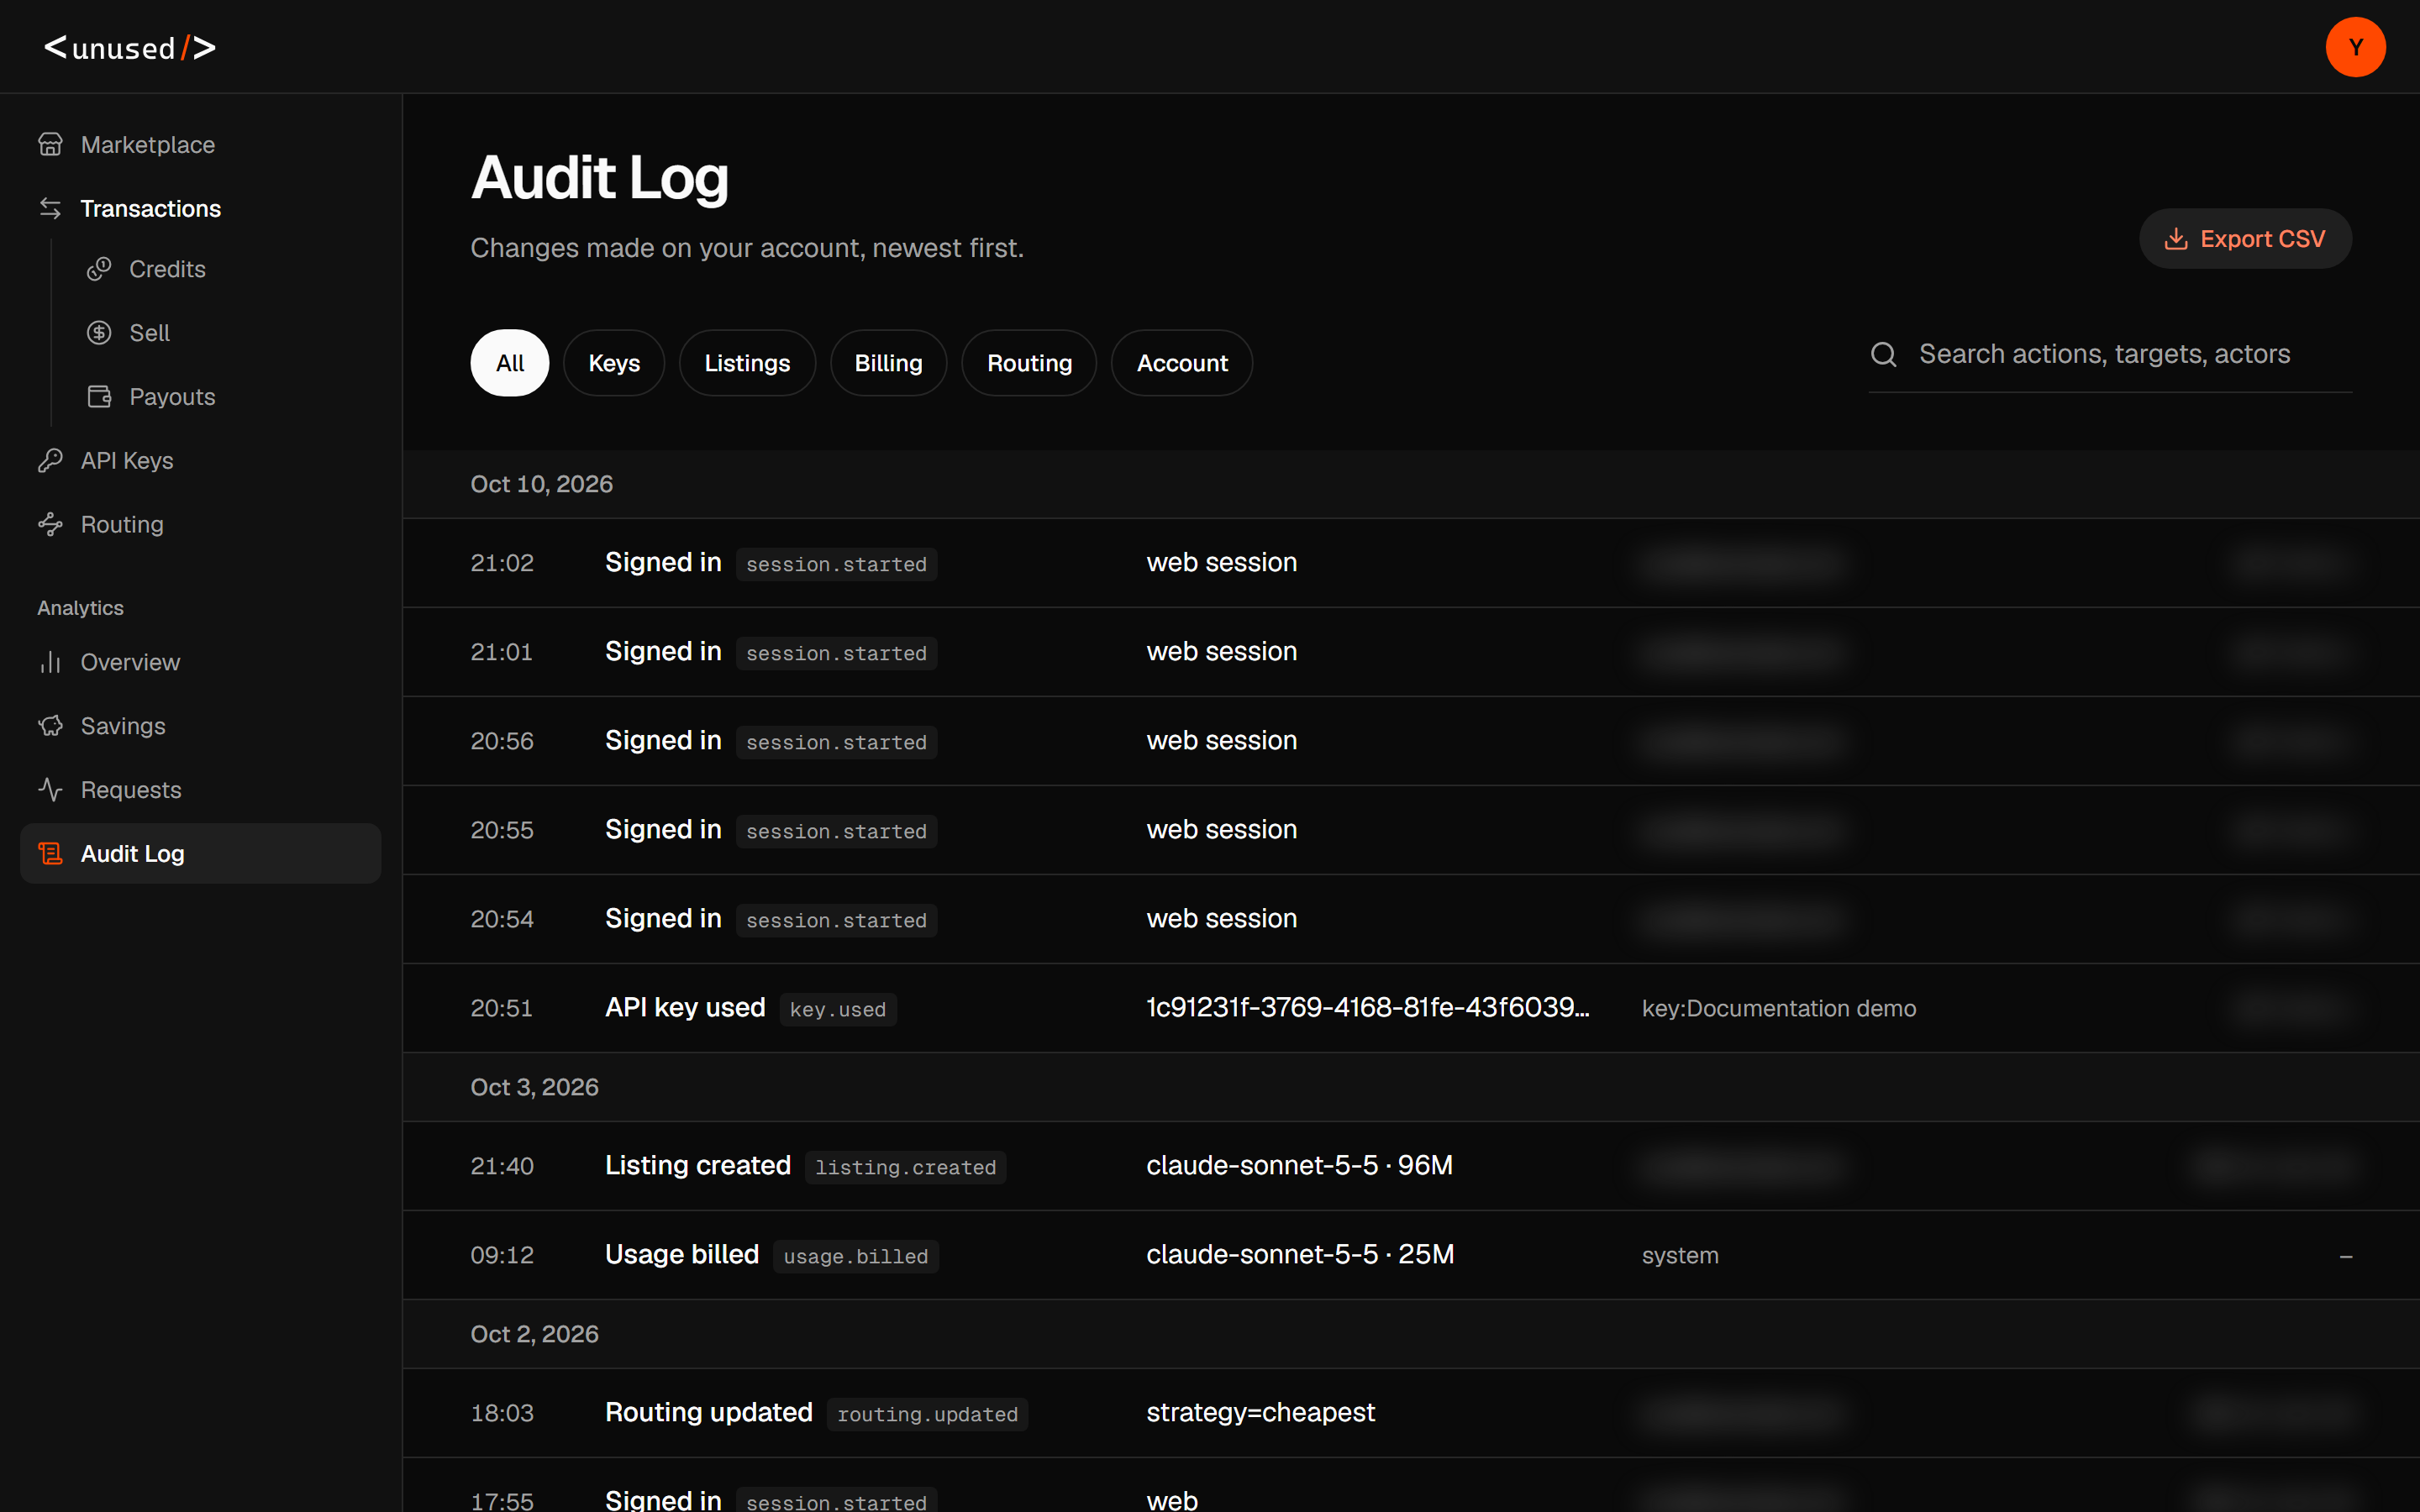
Open Analytics → Audit Log to find account events around a change in behavior.
| Field or filter | Meaning |
|---|---|
| Time | When the event was recorded. |
| Actor | The account or system actor recorded for the action. |
| Action | Event type, such as key creation/revocation, listing updates, or routing changes. |
| Target | Key name, listing, or other object affected. |
| IP | Recorded address associated with the event, when available. |
| Keys | Actions whose event name starts with key.. |
| Listings | listing. events. |
| Billing | credits., usage., and payout. events. |
| Routing | routing. events. |
| Account | account. and session. events. |
All removes the topic filter. Search matches actors, actions, targets, and IP addresses. Export CSV preserves the topic/search filters and produces id,time,actor,action,target,ip.
Use Routing to check when settings changed, or Keys to investigate a revoked key. The audit log identifies events; it is not a transcript of prompts or completions.